To provide our community with the most recent racial equity data, we update all RACE COUNTS data possible each year. When an important new indicator is published, we also add it to our data. This year’s updates included three meaningful improvements:
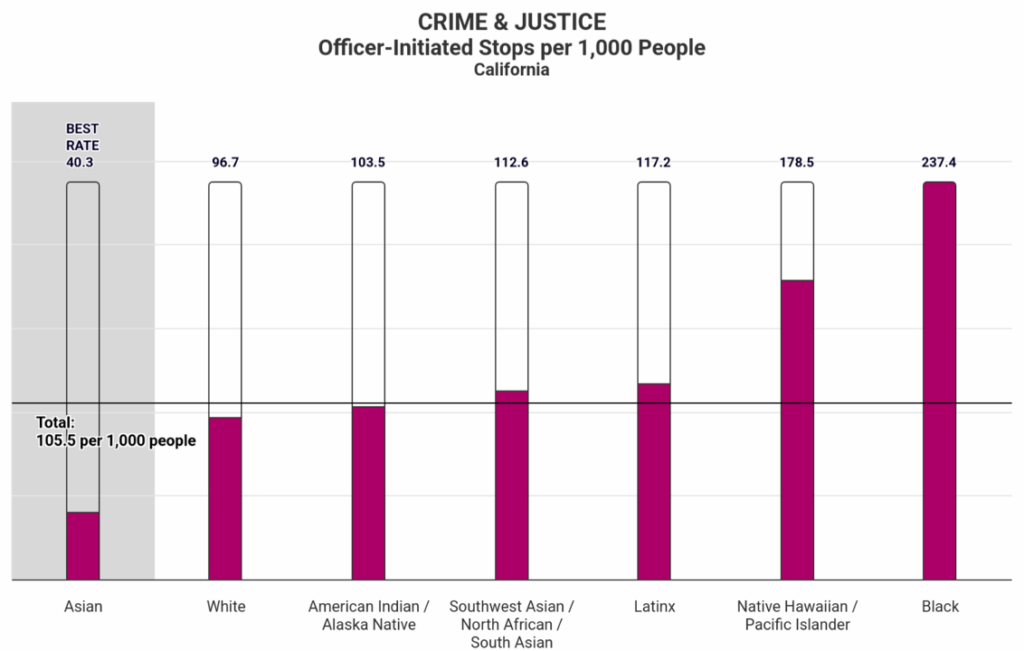
- First, the California Department of Justice has published new, more comprehensive data on law enforcement traffic stops for cities, counties, and the entire state. We’ve added officer-initiated stops to RACE COUNTS as an indicator for you to see the results where you live.
- Second, the California Department of Education has published data for the 2022-23 school year, giving us a sense of the post-COVID educational landscape, in which chronic absenteeism now plays a larger role. We’ve added this data so you can see what has changed at the state, county, and school district levels.
- Third, this update includes the best available data to date for BIPOC groups. Our biggest addition is the fourteen indicators now available for Southwest Asian and North African (SWANA) Californians. Find out more in our SWANA blog explaining the designation. Additionally, we have one more year of pooled survey data from sources like the California Health Interview Survey, which gives us more stable data for BIPOC groups than we’ve ever had before.
Why It Matters
The updated RACE COUNTS data reveal inequities Californians face more clearly than ever before, shows less impact from short-term variations caused by COVID, and includes detailed data for many groups that were invisible in previous analyses. While there is more work to do to acquire and publish newer and better data and for even more racial and ethnic subgroups, we have learned much through this update.
Our key findings:
- Statewide, law enforcement officers are more than twice as likely to stop Black Californians than the average Californian.
- Black, Native Hawaiian/Pacific Islander, and American Indian/Alaska Native students in California are all 3.5 times more likely to be chronically absent from school than the group with the lowest absenteeism rate.
- Statewide, SWANA residents are the most likely racial group to live near environmental hazards.
Limitations
Many data points in the update come from surveys. While statistically stable and screened to remove outliers and small populations, they still have margins of error which we don’t currently report. Also, while we’ve expanded the data available for many racial and ethnic groups, we know we can disaggregate data further. We’re working with partners to begin this work next year. Finally, while the data on the RACE COUNTS website is generally a year newer, even more data has been published while we’ve been working! We’ll update our data at least once again in 2025.
What’s Next
We have touched on only a few of the findings of the 2024 RACE COUNTS data update here, but we will publish our annual report with many more findings in early 2025. It will include disparity and outcome rankings as well as spotlights on local efforts to improve them. We also plan an in-depth report with partners on SWANA findings in early 2025 to support advocacy by SWANA communities. Finally, we did not add data by any new geographies this year, but we plan to report on data by state legislative districts (California Senate and Assembly) next year. Stay tuned for more updates!