By: Leila Forouzan
Senior Manager of Research & Data Analysis, Catalyst California
At RACE COUNTS, we strive to better reflect the diverse communities of California by constantly innovating in our analysis. Our biggest innovation this year is the addition of racial equity data for Southwest Asian and North African (SWANA) Californians. People in this group are also sometimes referred to as Middle Eastern or Middle Eastern and North African (MENA). The term ‘Middle Eastern’ is Eurocentric, as it names the region in relation to Europe and European culture. We use the SWANA label, which is based on geographic location.
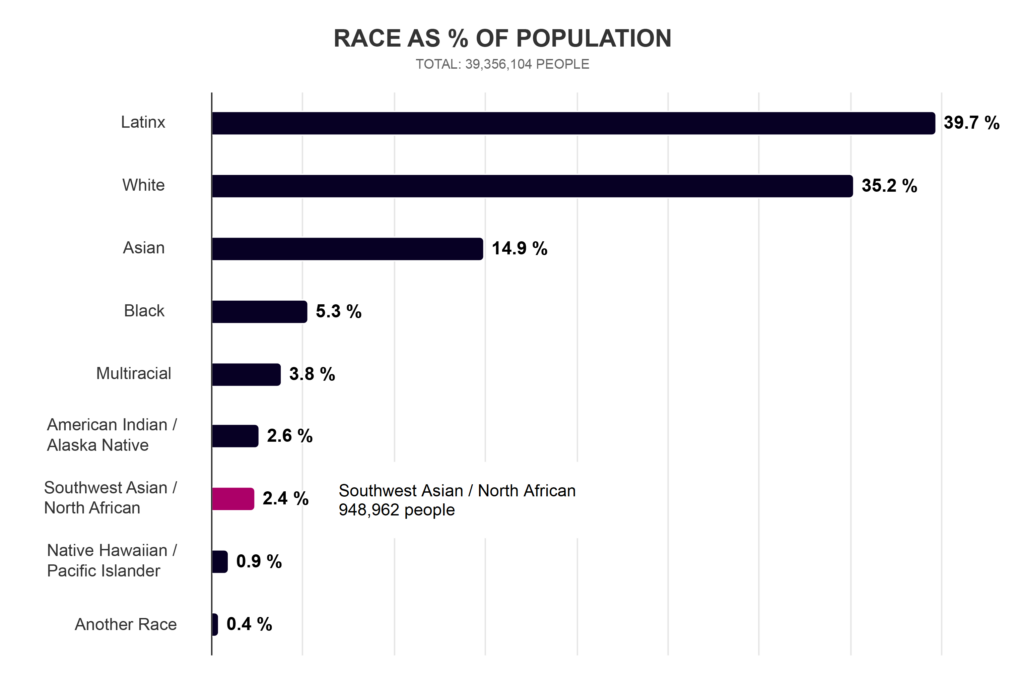
There are nearly one million SWANA people in California. This community is diverse in terms of national identity, ethno-religious identity, and more. And yet, people in this group also have much in common.
Public data systematically erase SWANA people by grouping them as White, though many do not identify that way. Moreover, research indicates the experiences of SWANA Californians differ significantly from White Californians. But the lack of data has made it difficult to measure the racial disparities that exist for this group.
At RACE COUNTS, we have devised methods to analyze data about SWANA people that, to our knowledge, have not been explored before. Our process included researching the existing SWANA data landscape, developing a draft methodology, sharing the methodology with SWANA-serving organizations, and integrating their feedback.
Why It Matters
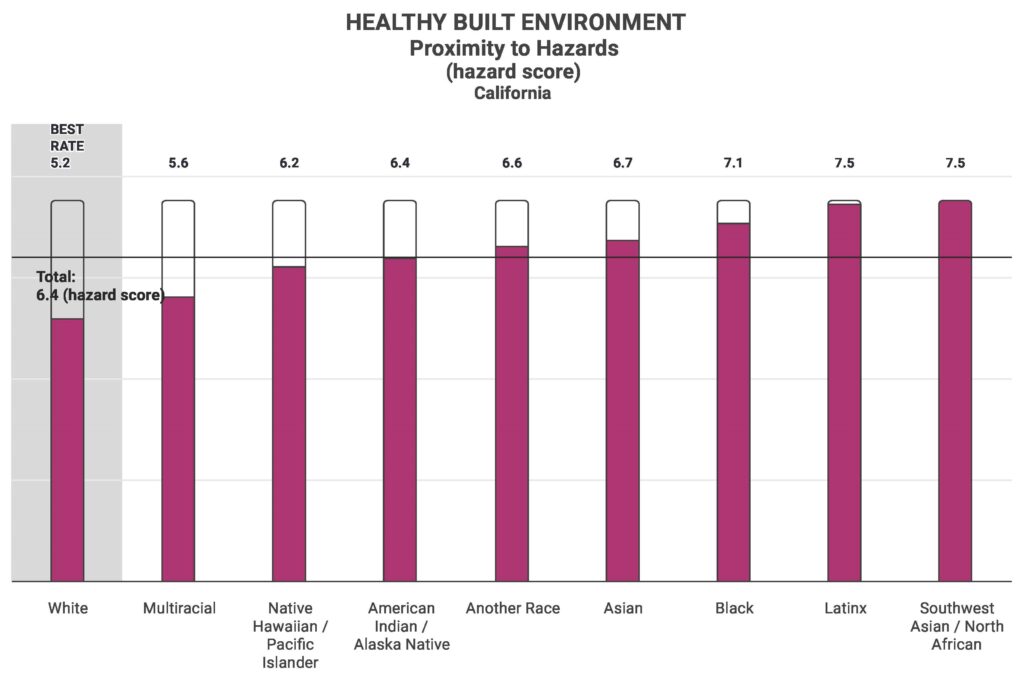
The new RACE COUNTS data reveal some of the inequities SWANA Californians face. There is evidence that SWANA Californians face some of the worst inequity when it comes to the built environment.
Key findings:

- Statewide, SWANA residents are the most likely to live close to environmental hazards, and they have the second-highest exposure to contaminated drinking water.
- Statewide, police officers are more likely to stop SWANA residents1 than the average Californian.
- In Los Angeles County, SWANA residents are the least likely to get help for self-diagnosed mental/emotional or alcohol/drug issues.
- In Stanislaus County, SWANA youth are least likely to be in school and/or employed.
- In Orange County, SWANA birthing parents2 are the second most likely to have a baby with low birthweight.
And yet, because there is so little data available in indicators for Education, Democracy, or Housing, we cannot see the full picture. We hope to expand our baseline SWANA data in the future, but what we have now still offers valuable new insights into the SWANA experience in California.
Limitations
Data limitations include low representation across issue areas, inconsistencies in the definition of SWANA across data sources, and small sample sizes that lead to questions of data reliability. Even so, our new methodology allowed us to analyze racial equity for SWANA Californians on 14 out of 47 indicators at the county and state level, and six at city level. The lack of data in data sources and/or lack of corresponding population data limited the number of indicators we could use to measure racial inequity.
Of the 14 county and state level indicators available for SWANA, only one is a Housing indicator. There are no Democracy or Education indicators available. At city level, only Crime and Justice and Healthy Built Environment indicators have SWANA data. One of the main data sources we use to analyze SWANA disparities is the American Community Survey ancestry data (Table B04006 and PUMS), so in many cases we are limited by the ancestry labels and definitions the Census Bureau uses.
What’s Next
While RACE COUNTS now has insights into the racial disparities SWANA Californians face, the picture is incomplete. The lack of SWANA data and inconsistency in the definition of SWANA are pervasive.
Efforts to address the limitations have had mixed results. AB 2763 would require state agencies to add a SWANA category to forms that collect race/ethnicity data, using the term MENA. But state legislators held this bill at the committee level. On the other hand, the federal government recently approved adding a SWANA response, again using the term MENA, to their race and ethnicity data collection. RACE COUNTS will continue to advocate for more accurate, consistent data and for more data collection. In the meantime, we are working on a special RACE COUNTS report about SWANA Californians to be released in early 2025.
The conflict in Gaza over the past year has given new urgency to our efforts to reverse the historic erasure of this group. We encourage all Californians to learn more and connect with SWANA-serving organizations across the state. We have included a few below:
- In this dataset, CA Department of Justice, Racial Identity and Profiling Act, race is identified by the law enforcement officer. ↩︎
- The data source, CDC WONDER database, includes only foreign-born SWANA birthing parents. ↩︎
